
Track California's solar capacity and incentive flow.
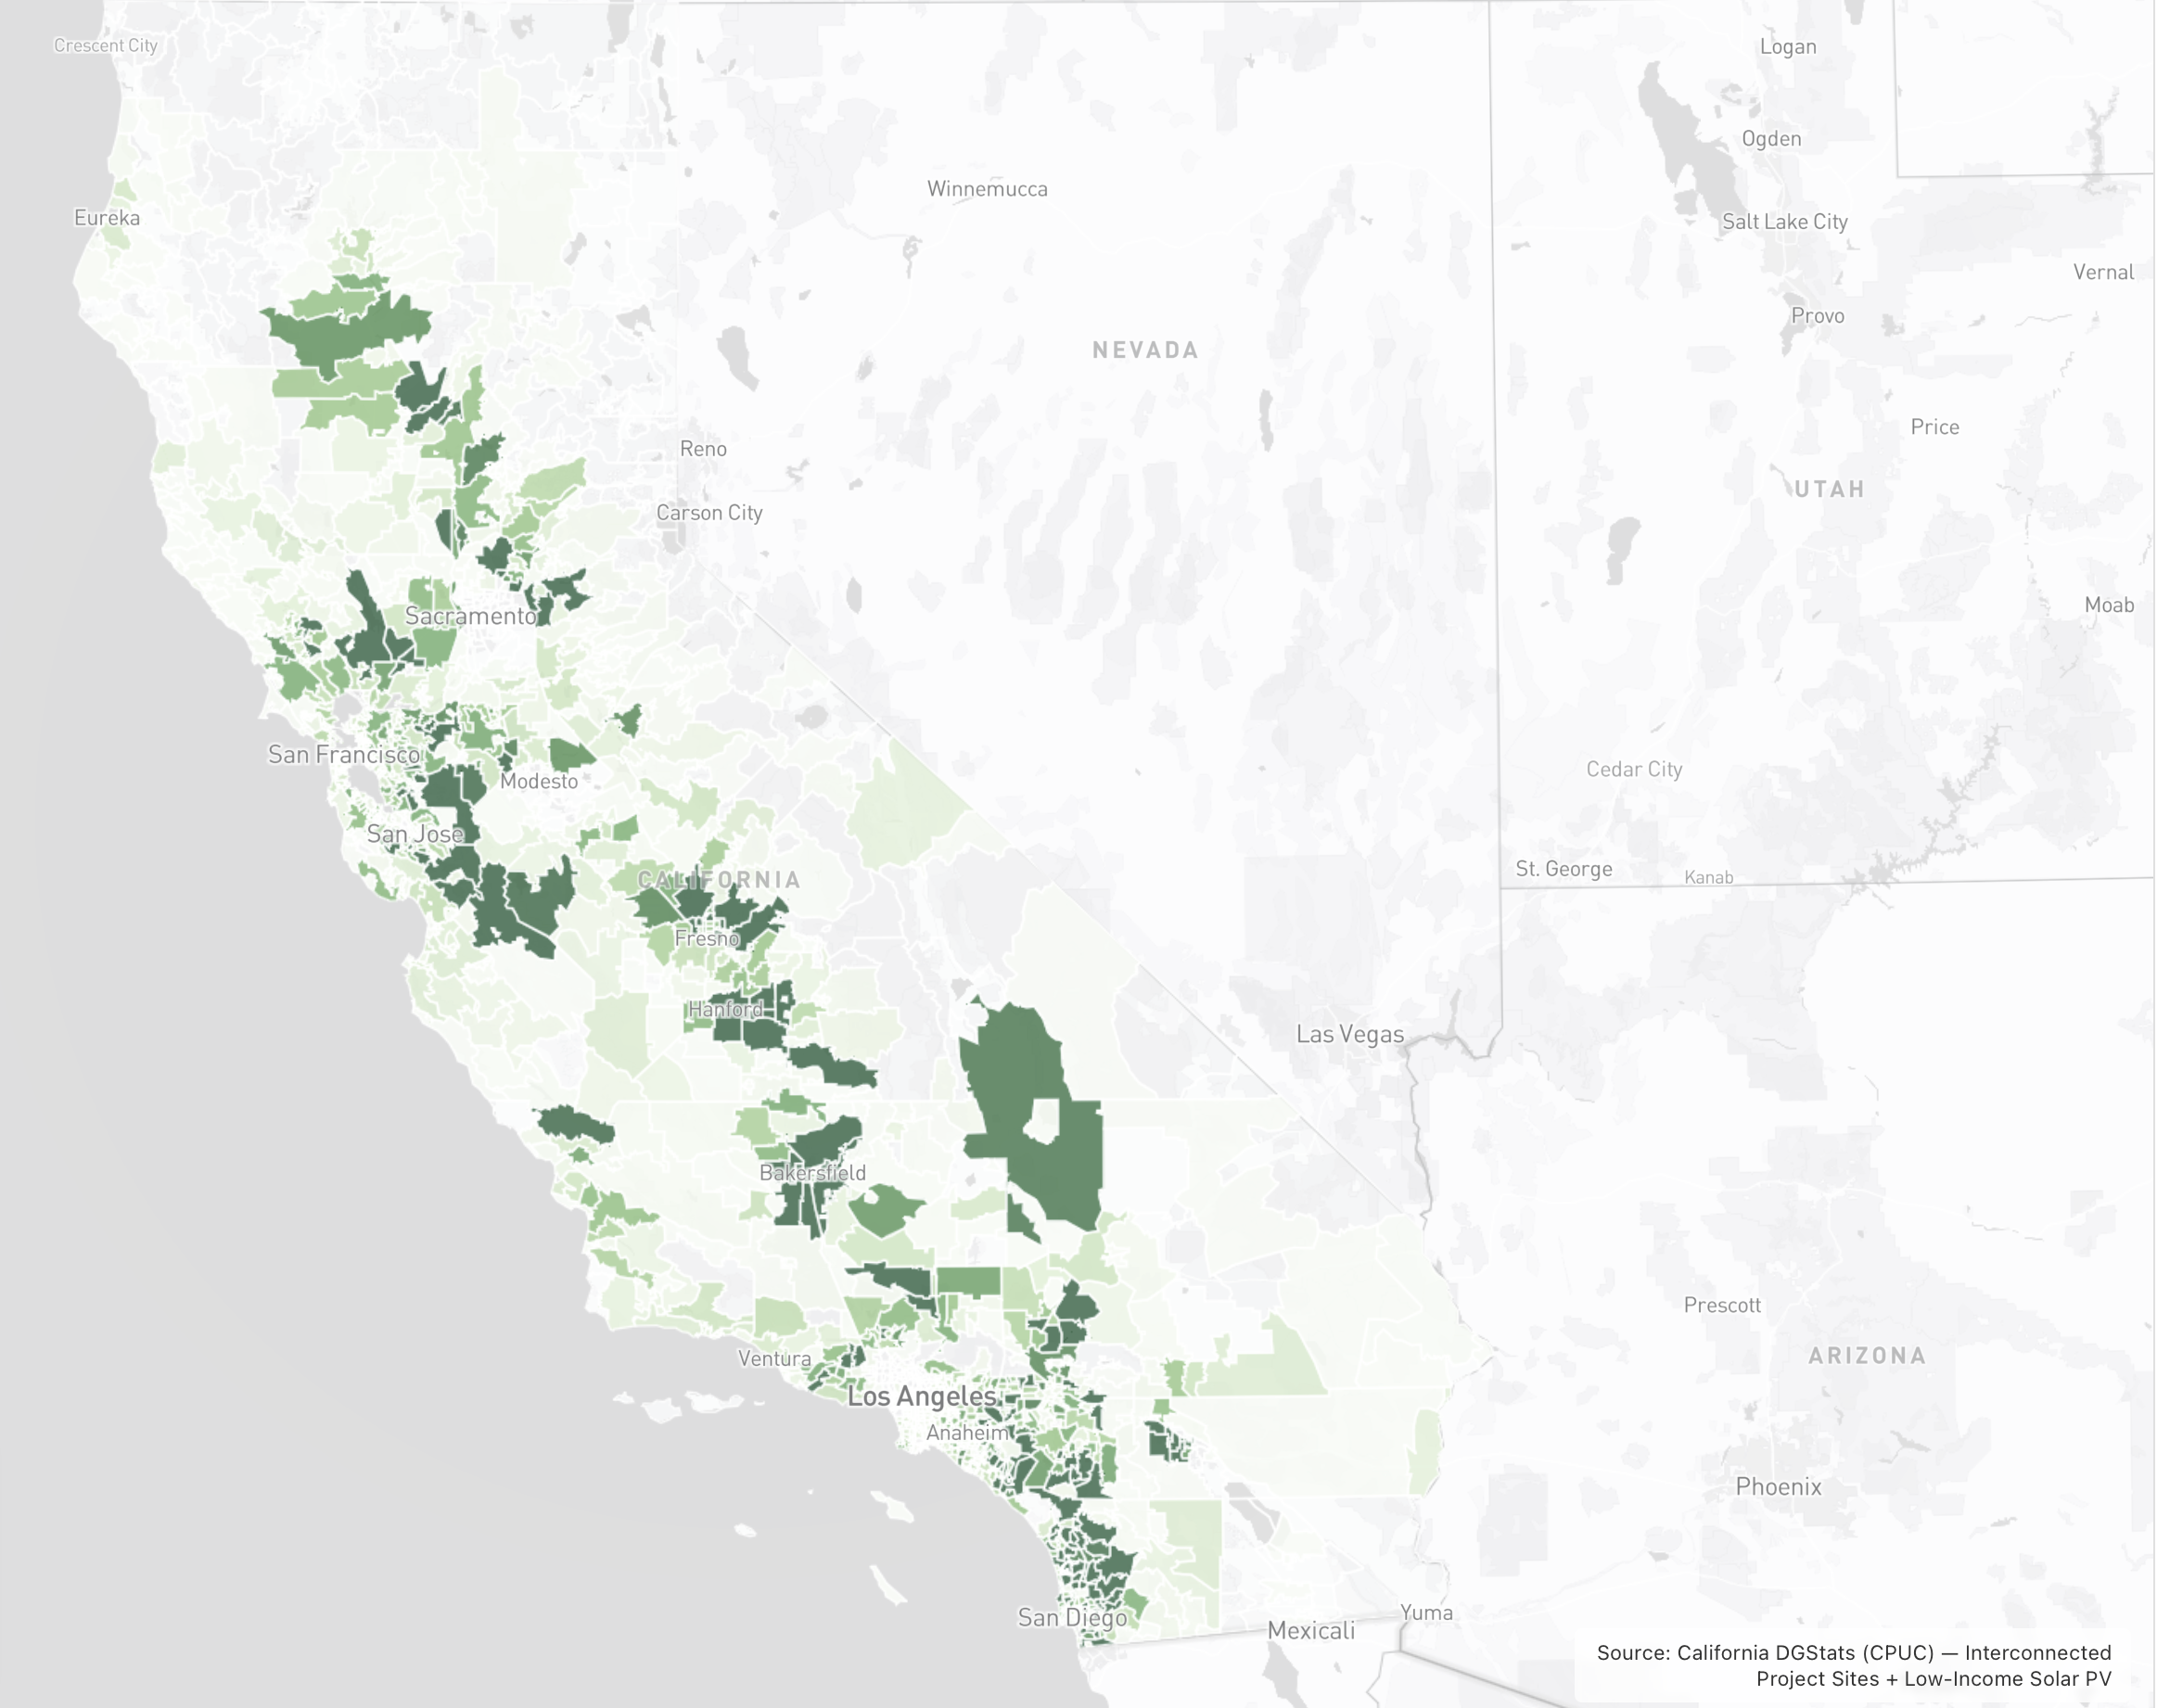
We map where solar capacity is being built, how incentinve dollars are distributed, and what the data implies — with an audit trail that stands up to scrutiny.
What this makes possible
Reliable, official solar data
Sourced directly from California DGStats and updated monthly so insights stay current.
Metrics that illuminate impact
ZIP-level subsidized capacity and deployment data you can explore and compare.
Built for scrutiny
Transparent methodology: sources, assumptions, and limitations are clearly cited.
Frequently asked questions
The data is from DGStats. More on Data here.
The Interconnected dataset has been filtered to include only:
- Interconnected (projects that have actually been installed)
- Residential (other sectors have been excluded)
Furthermore:
- Rows with $0 or null Total System Cost and 0 kW or null System Size AC are removed.
- Records with missing or unparseable App Complete Date are discarded.
- Strict regex enforcement (
^\d{5}$) removes any ZIP code that is not exactly five digits or contains alphabets/symbols. -
After aggregation, any ZIP × month × year group with
market_total_cost < $50is excluded (to remove rounding artifacts and clearly invalid totals). Rationale: installed residential PV systems are typically priced on the order of ~$2.5–$3.3 per watt, meaning even a 1 kW system is generally ~$2,500–$3,300 before incentives.
Read more on data processing and data keys for the Interconnected raw data here.
The Low-Income data filters out the following:
- Only applications with a Current Application Status of “Completed” are processed.
- Any record with $0 or null Total System Cost or 0 kW CEC PTC Rating (KW) is discarded.
- Any record where Incentive Amount exceeds Total System Cost (paid > cost) is excluded.
- Strict regex enforcement (
^\d{5}$) removes any entry that is not a clean, 5-digit number, effectively purging alphabetic or international placeholders.
Read more on data processing and data keys for the Low-Income raw data here.
The Low-Income incentive data is updated weekly on Thursday mornings. The broader Interconnection market data is updated monthly.
Because the “Interconnected” data and “Low-Income” data live in separate databases, we link them using ZIP as the common denominator. By aggregating both datasets to the ZIP level, we can compare how much public money was spent in a neighborhood versus the total solar activity in that same area.
In 2006, California passed Assembly Bill (AB) 2723, which mandated that at least 10% of all state solar funds must benefit low-income properties. Later, AB 217 (2013) extended these programs with an additional $108 million to ensure solar wasn’t just for wealthy homeowners.
Eligibility is defined by properties qualifying as affordable housing or households meeting annual income limits set by the California Alternate Rates for Energy (CARE) or Family Electric Rate Assistance (FERA) guidelines. This project focuses exclusively on the “modern era” of state-funded low-income solar initiatives: MASH, SASH, and DAC-SASH.
These programs are overseen by the California Public Utilities Commission (CPUC) and are funded by the customers of the state’s large electric utilities (PG&E, SCE, and SDG&E).